Sharetree’s chamber programming and control system
All of Sharetree’s thermal and environmental chambers are equipped with our proprietary SIMPLEtouch controller. This allows you to view the current operating data, set the target values and program temperature and humidity profiles.
The controller comprises an internal Windows-based PC with a user-friendly touchscreen interface (the standard 7-inch display is upgradeable to desktop size on larger chambers). At its heart is an industry-standard PID controller that is readily maintained or replaced, minimising downtime.
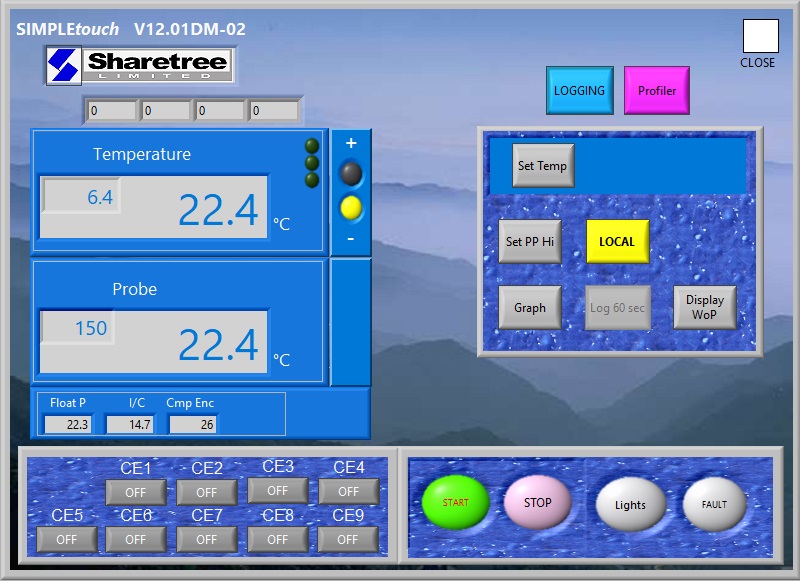
The software is Labview-based and developed by Sharetree, so it can be easily upgraded and customised. With single-button actions for most functions, it is simple to learn and use. The screen gives a clear view of the current status of the chamber, even from a distance, showing the target and actual values for temperature and humidity and any active alarms.
Key Features
QuikSet Entry
Set up fixed conditions with our QuikSet entry; a single button press opens a touchscreen keypad with large buttons for setting the required temperature and/or humidity.
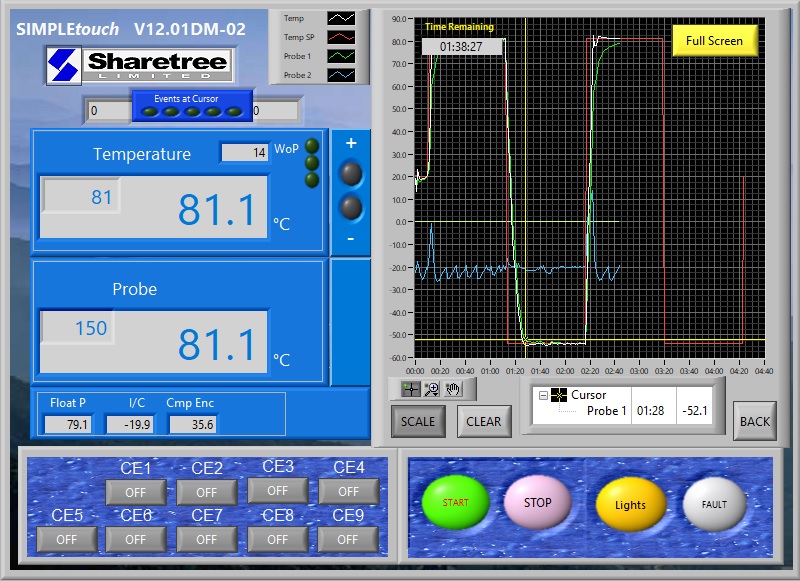
Comprehensive Graphical Display
Use normal touchscreen gestures to zoom in to graphs and pan along the x or y axes; use the pointer to display the conditions at a specific location on the graph.
Clear, Easy-to-Read Display
With 8” to 12” displays and an uncluttered graphics, the chamber condition can be seen clearly without having to walk over to it.
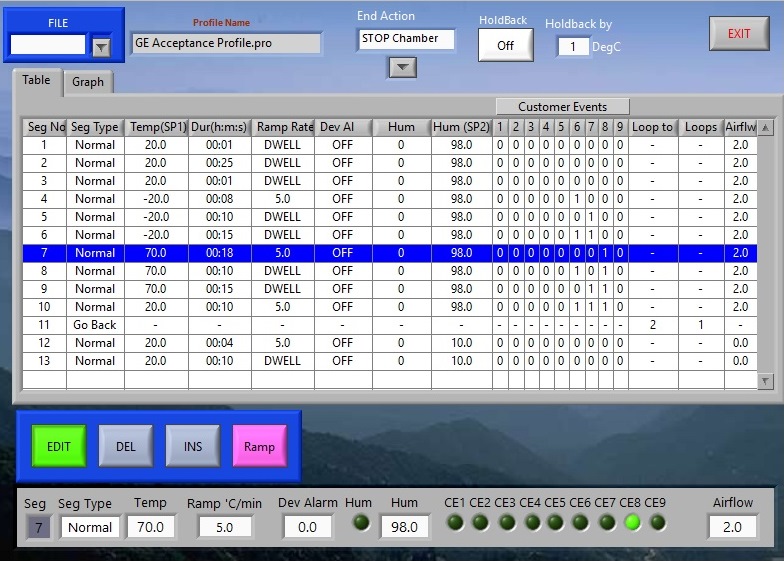
Complex Profiling
Temperature and humidity profiles can be created which contain nested loops, pauses, and ‘end’ or ‘dwell’ stages.
Logging to File
Log files are created automatically when a profile is run but can also be started manually. The log file format is .csv for quick importing into spreadsheet packages such as Excel. Files are readily downloaded via the USB port.
Wide Range of Comms Interfaces
SIMPLEtouch comes as standard with a TCP-IP (LAN) MODbus interface for remote monitoring and/or control. There are also Translator programs available for RS232, GPIB and even BiSync interfaces.
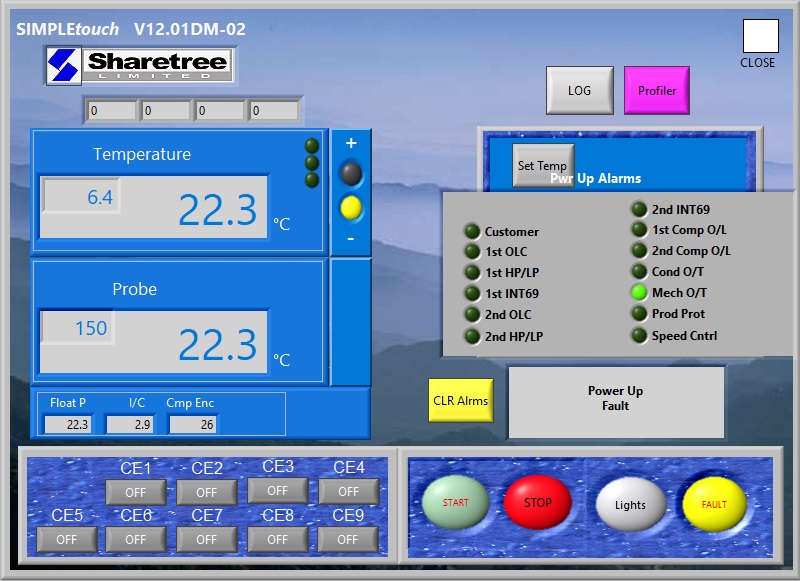
Latching Fault Indicator Screen
On more powerful chambers, faults are displayed as a list of on-screen “LEDs” with a description of the fault. Faults remain displayed (‘latched’) until resolved and cleared by the user. Faults are also logged for future reference.
Diagnostic Screen
More powerful chambers feature comprehensive reporting of data such as refrigerant gas pressures, compressor currents, intercooler temperature, etc.
SIMPLEtouch includes a host of features as standard such as graphing, logging, profiling, and diagnostics (on larger chambers)
SIMPLEtouch provides a clear display and single-button actions for most functions, making the controller easy to use
Graphs and Logging
The SIMPLEtouch controller displays graphs showing the target and actual operating values. The graphs can be displayed over the entire screen for enhanced clarity. You can auto-scale, zoom in/out, expand an area, and use a cursor to check specific values and event status at any location on the graph.
The data (including the status of deviation alarms) for both profiles and fixed conditions can be logged to a .csv file (with adjustable intervals) and retrieved for viewing either on the SIMPLEtouch controller or using external software such as MS Excel. Inputs from up to 5 floating probes (optional) may also be displayed and logged.
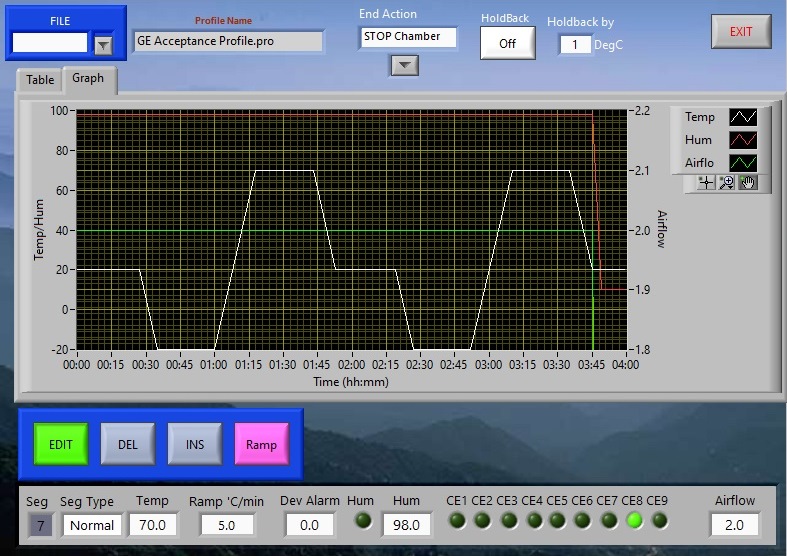
The Profile Editor can be installed on any Windows PC for your comfort while editing your profile, which is then transferred to the controller
The Profile Editor features a graphical display of your program profile, including nested loops
Programming
The Profile Editor allows you to quickly create or edit programs (off-line, if preferred) for applying a series of changing conditions inside the chamber. A large number of these profiles can be stored in the controller’s memory and reused. Each profile consists of segments of constant temperature/humidity, time intervals and customer events. An unlimited number of segments (subject only to PC memory limits) may be included in a program, each with its own set of deviation alarms.
Complex profiles that include nested loops can be quickly programmed using the ‘loop-back’ facility. Ramp rates may be entered either directly or as time-to-temperature. Use ‘hold-back’ to ensure temperatures are reached before a dwell stage begins. At the end of the program, use the ‘end’ function to dwell at a fixed temperature or to stop the chamber.
When running a profile, the total time remaining is displayed. The ‘hold’ function allows manual intervention and the ‘start at’ function allows the profile to be run from any point. The graph displays the complete profile and the recorded temperature/humidity as it progresses.